Microsoft Project 2016 – Views That You Can Use
Microsoft Project collects, derives and maintains a lot of data which is necessary for effective scheduling, tracking and reporting projects. To systematically present the data to users, MS Project has several views. Every view presents data in a format logical to users. Addressing some common requirements, Microsoft has provided some readymade views and allow users to customize them to fit their specific needs or create new views from the scratch altogether.
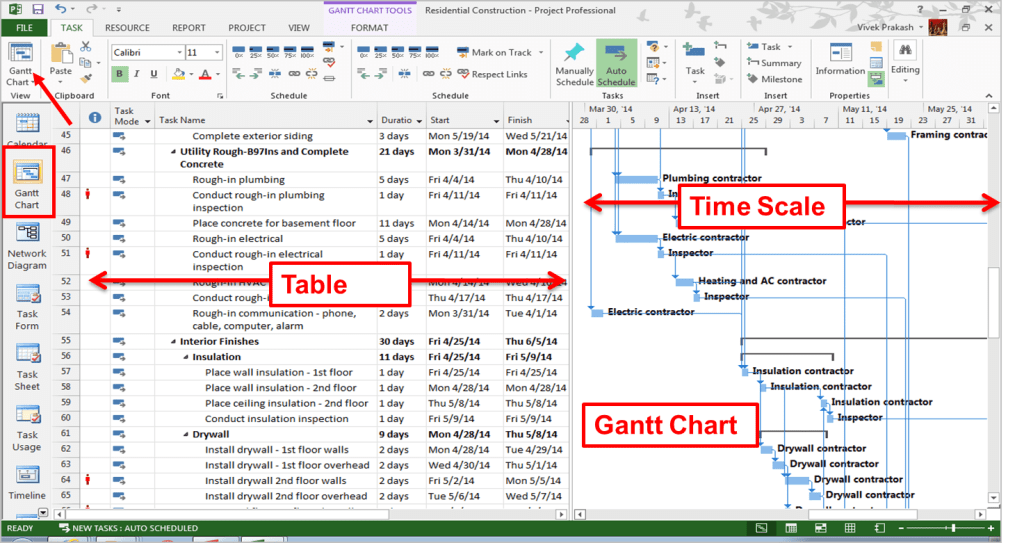
Let’s first understand what a views is. A View in Microsoft Project is a representation of data in the form of table and graph. For examples, let’s look into Gantt Chart view shown below.
Gantt Chart View:
There are two sections – Table on left hand side and Graph on right hand side. Traditionally a Gantt Chart contains Tasks names, tasks duration, start and finish dates and a bar chart drawn based on tasks duration. Names, duration, start and finish dates are presented in the tables on left hand side and bar chart (called Gantt Chart) is presented in the graph on right hand side.

Similarly MS Project has several pre-defined view catering to various standard requirements of project managers. I will discuss some views here that are commonly used by project managers to perform their day to day scheduling work.
Resource Sheet View:
While Gantt Chart is mostly task oriented, Resource Sheet view is resource oriented. This view contains only table with commonly used columns. We can use this view to add/remove/edit resource information. By double clicking on a resource row or selecting Information on Resource Tab will open Resource Information dialogue box to edit detailed information about resources. We will be covere the details later.

Task Usage View:
If we want to see tasks and resources together, Task Usages is the view. It has two sections. Left hand side is a table and right hand side is resource allocation. In this view, we can also see list of resources working on a task. On right hand side, it displays day wise resource allocation on tasks.

Resource Usage View:
If we want to see list of tasks, a resource is working on, Resource Usages is the view. Similar to Task Usage view, it also has two sections. Left hand side is a table and right hand side is resource allocation. In this view, we can see list of tasks on which resources are working. On right hand side, it displays day wise resource allocation on tasks.

Tracking Gantt Chart View:
Tracking Gantt Chart looks similar to Gantt Chart. The main purpose of Tracking Gantt Chart is to monitor tasks progress and compare it against baseline. On the Gantt Chart, it displays two bars for every tasks – one for current plan and other for baseline plan.
![]()
Network Diagram View:
As the name indicates, Network Diagram View displays a project network diagram mainly displaying dependencies among project activities. Now when dependencies are also displayed in Gantt Chart, this View is almost redundant.

Combination View:
Combination View means we can see two views at the same time. One View often displays limited information. If we want to see more information about tasks to prepare schedule, Combination View make it easy. It provides another view on the same screen displaying additional information on the task currently selected. One can get Combination View by selecting Details on the View Tab.

Timeline View:
Timeline View is a summary view. It provide a bird eye view of the project. Project 2016 has provision for multiple timelines giving options to provide need based details by adding timelines in the view. It is a good view for senior people to get a snapshot of their project and ponder on major milestone.

Team Planner View:
Team Planner View is like a Gantt Chart prepared based on Resources. It sketches bar chart for every resource having bar length as per tasks duration allocated to resources. It highlights over-allocations and tasks that are left unassigned. One can also see when a resource has no allocation. It is a good view to level the resources.

I hope it will help you to select more appropriate views for the information you would like to see and make you more effective in scheduling and tracking your projects. I look forward for your comments.